- 安装heapster插件
- 准备镜像
- 准备YAML文件
- 配置 grafana-deployment
- 配置 heapster-deployment
- 配置 influxdb-deployment
- 配置 monitoring-influxdb Service
- 执行所有定义文件
- 检查执行结果
- 访问 grafana
- 访问 influxdb admin UI
- 注意
- 参考
安装heapster插件
准备镜像
官方镜像保存在 gcr.io 中需要翻墙才能下载,为了方便大家使用,我下载后放到了时速云中,为公有镜像供大家下载。
- index.tenxcloud.com/jimmy/heapster-amd64:v1.3.0-beta.1
- index.tenxcloud.com/jimmy/heapster-influxdb-amd64:v1.1.1
- index.tenxcloud.com/jimmy/heapster-grafana-amd64:v4.0.2
准备YAML文件
到 heapster release 页面 下载最新版本的 heapster。
wget https://github.com/kubernetes/heapster/archive/v1.3.0.zipunzip v1.3.0.zipmv v1.3.0.zip heapster-1.3.0
文件目录: heapster-1.3.0/deploy/kube-config/influxdb
$ cd heapster-1.3.0/deploy/kube-config/influxdb$ ls *.yamlgrafana-deployment.yaml grafana-service.yaml heapster-deployment.yaml heapster-service.yaml influxdb-deployment.yaml influxdb-service.yaml heapster-rbac.yaml
我们自己创建了heapster的rbac配置heapster-rbac.yaml。
已经修改好的 yaml 文件见:../manifests/heapster
配置 grafana-deployment
$ diff grafana-deployment.yaml.orig grafana-deployment.yaml16c16< image: gcr.io/google_containers/heapster-grafana-amd64:v4.0.2---> image: harbor-001.jimmysong.io/library/heapster-grafana-amd64:v4.0.240,41c40,41< # value: /api/v1/proxy/namespaces/kube-system/services/monitoring-grafana/< value: /---> value: /api/v1/proxy/namespaces/kube-system/services/monitoring-grafana/> #value: /
- 如果后续使用 kube-apiserver 或者 kubectl proxy 访问 grafana dashboard,则必须将
GF_SERVER_ROOT_URL设置为/api/v1/proxy/namespaces/kube-system/services/monitoring-grafana/,否则后续访问grafana时访问时提示找不到http://172.20.0.113:8086/api/v1/proxy/namespaces/kube-system/services/monitoring-grafana/api/dashboards/home页面;
配置 heapster-deployment
$ diff heapster-deployment.yaml.orig heapster-deployment.yaml16c16< image: gcr.io/google_containers/heapster-amd64:v1.3.0-beta.1---> image: harbor-001.jimmysong.io/library/heapster-amd64:v1.3.0-beta.1
配置 influxdb-deployment
influxdb 官方建议使用命令行或 HTTP API 接口来查询数据库,从 v1.1.0 版本开始默认关闭 admin UI,将在后续版本中移除 admin UI 插件。
开启镜像中 admin UI的办法如下:先导出镜像中的 influxdb 配置文件,开启 admin 插件后,再将配置文件内容写入 ConfigMap,最后挂载到镜像中,达到覆盖原始配置的目的:
注意:manifests 目录已经提供了修改后的 ConfigMap 定义文件。
$ # 导出镜像中的 influxdb 配置文件$ docker run --rm --entrypoint 'cat' -ti lvanneo/heapster-influxdb-amd64:v1.1.1 /etc/config.toml >config.toml.orig$ cp config.toml.orig config.toml$ # 修改:启用 admin 接口$ vim config.toml$ diff config.toml.orig config.toml35c35< enabled = false---> enabled = true$ # 将修改后的配置写入到 ConfigMap 对象中$ kubectl create configmap influxdb-config --from-file=config.toml -n kube-systemconfigmap "influxdb-config" created$ # 将 ConfigMap 中的配置文件挂载到 Pod 中,达到覆盖原始配置的目的$ diff influxdb-deployment.yaml.orig influxdb-deployment.yaml16c16< image: gcr.io/google_containers/heapster-influxdb-amd64:v1.1.1---> image: harbor-001.jimmysong.io/library/heapster-influxdb-amd64:v1.1.119a20,21> - mountPath: /etc/> name: influxdb-config22a25,27> - name: influxdb-config> configMap:> name: influxdb-config
配置 monitoring-influxdb Service
$ diff influxdb-service.yaml.orig influxdb-service.yaml12a13> type: NodePort15a17,20> name: http> - port: 8083> targetPort: 8083> name: admin
- 定义端口类型为 NodePort,额外增加了 admin 端口映射,用于后续浏览器访问 influxdb 的 admin UI 界面;
执行所有定义文件
$ pwd/root/heapster-1.3.0/deploy/kube-config/influxdb$ ls *.yamlgrafana-service.yaml heapster-rbac.yaml influxdb-cm.yaml influxdb-service.yamlgrafana-deployment.yaml heapster-deployment.yaml heapster-service.yaml influxdb-deployment.yaml$ kubectl create -f .deployment "monitoring-grafana" createdservice "monitoring-grafana" createddeployment "heapster" createdserviceaccount "heapster" createdclusterrolebinding "heapster" createdservice "heapster" createdconfigmap "influxdb-config" createddeployment "monitoring-influxdb" createdservice "monitoring-influxdb" created
检查执行结果
检查 Deployment
$ kubectl get deployments -n kube-system | grep -E 'heapster|monitoring'heapster 1 1 1 1 2mmonitoring-grafana 1 1 1 1 2mmonitoring-influxdb 1 1 1 1 2m
检查 Pods
$ kubectl get pods -n kube-system | grep -E 'heapster|monitoring'heapster-110704576-gpg8v 1/1 Running 0 2mmonitoring-grafana-2861879979-9z89f 1/1 Running 0 2mmonitoring-influxdb-1411048194-lzrpc 1/1 Running 0 2m
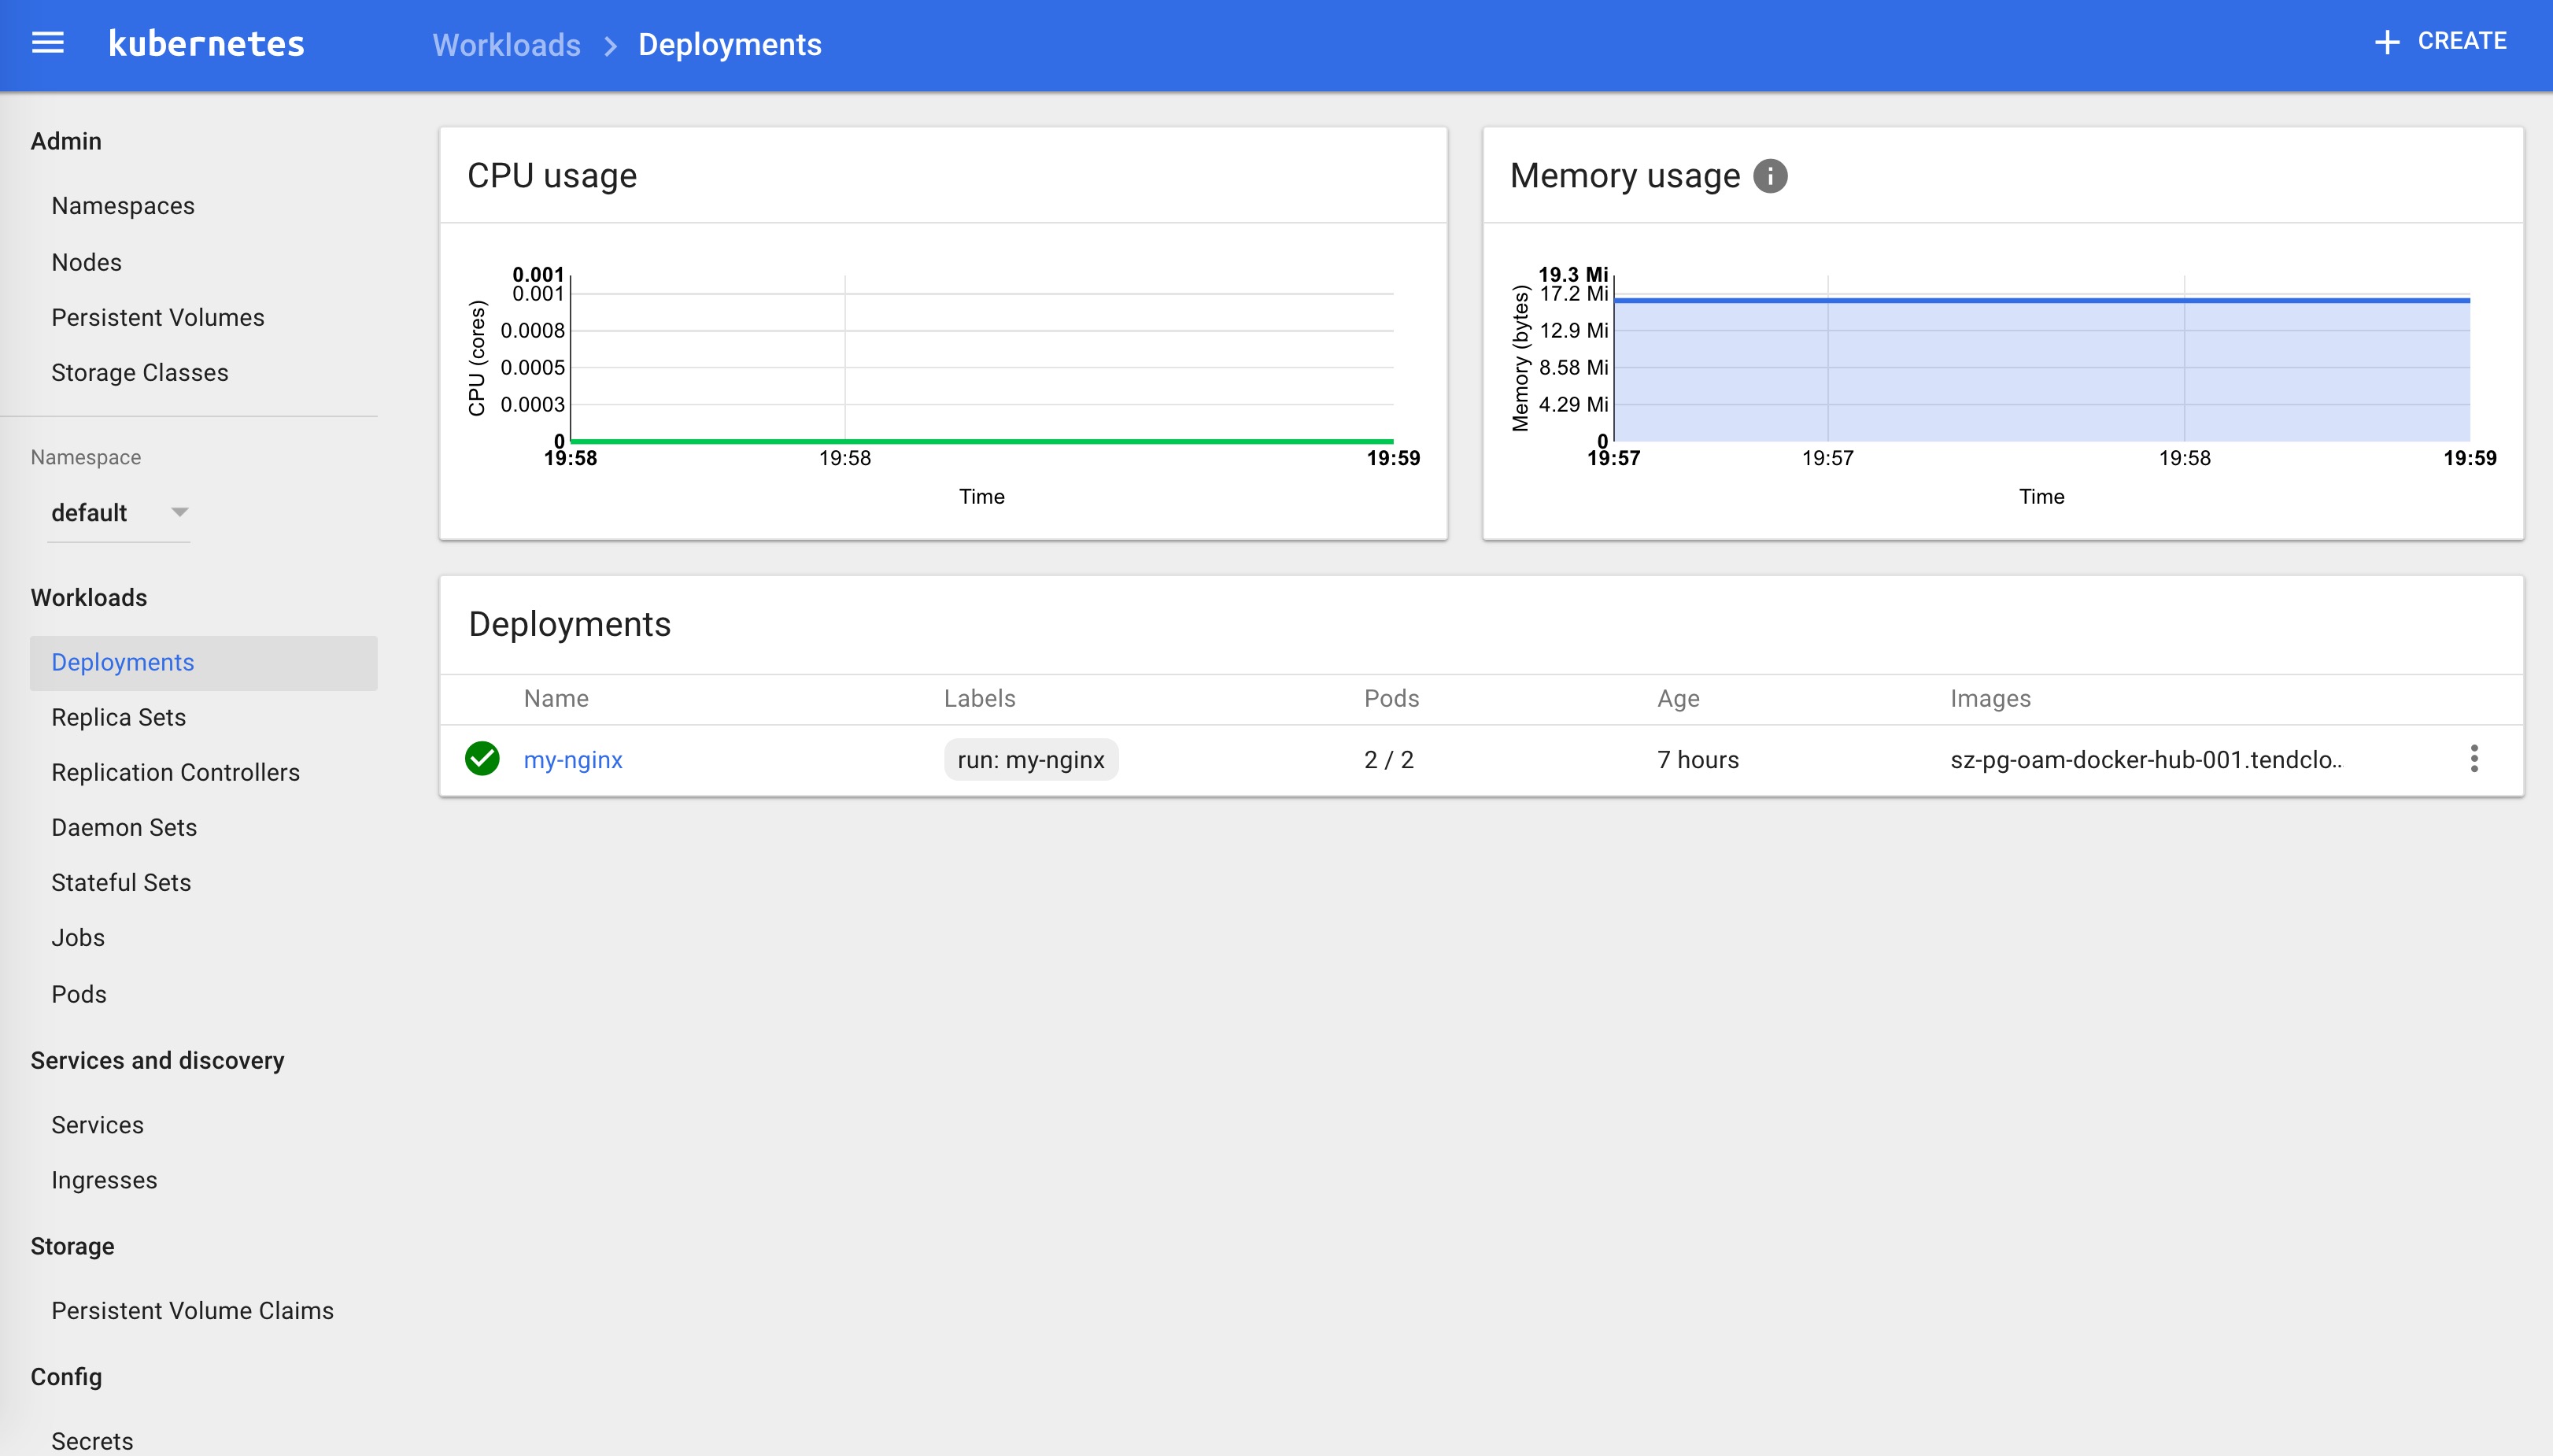
检查 kubernets dashboard 界面,看是显示各 Nodes、Pods 的 CPU、内存、负载等利用率曲线图;
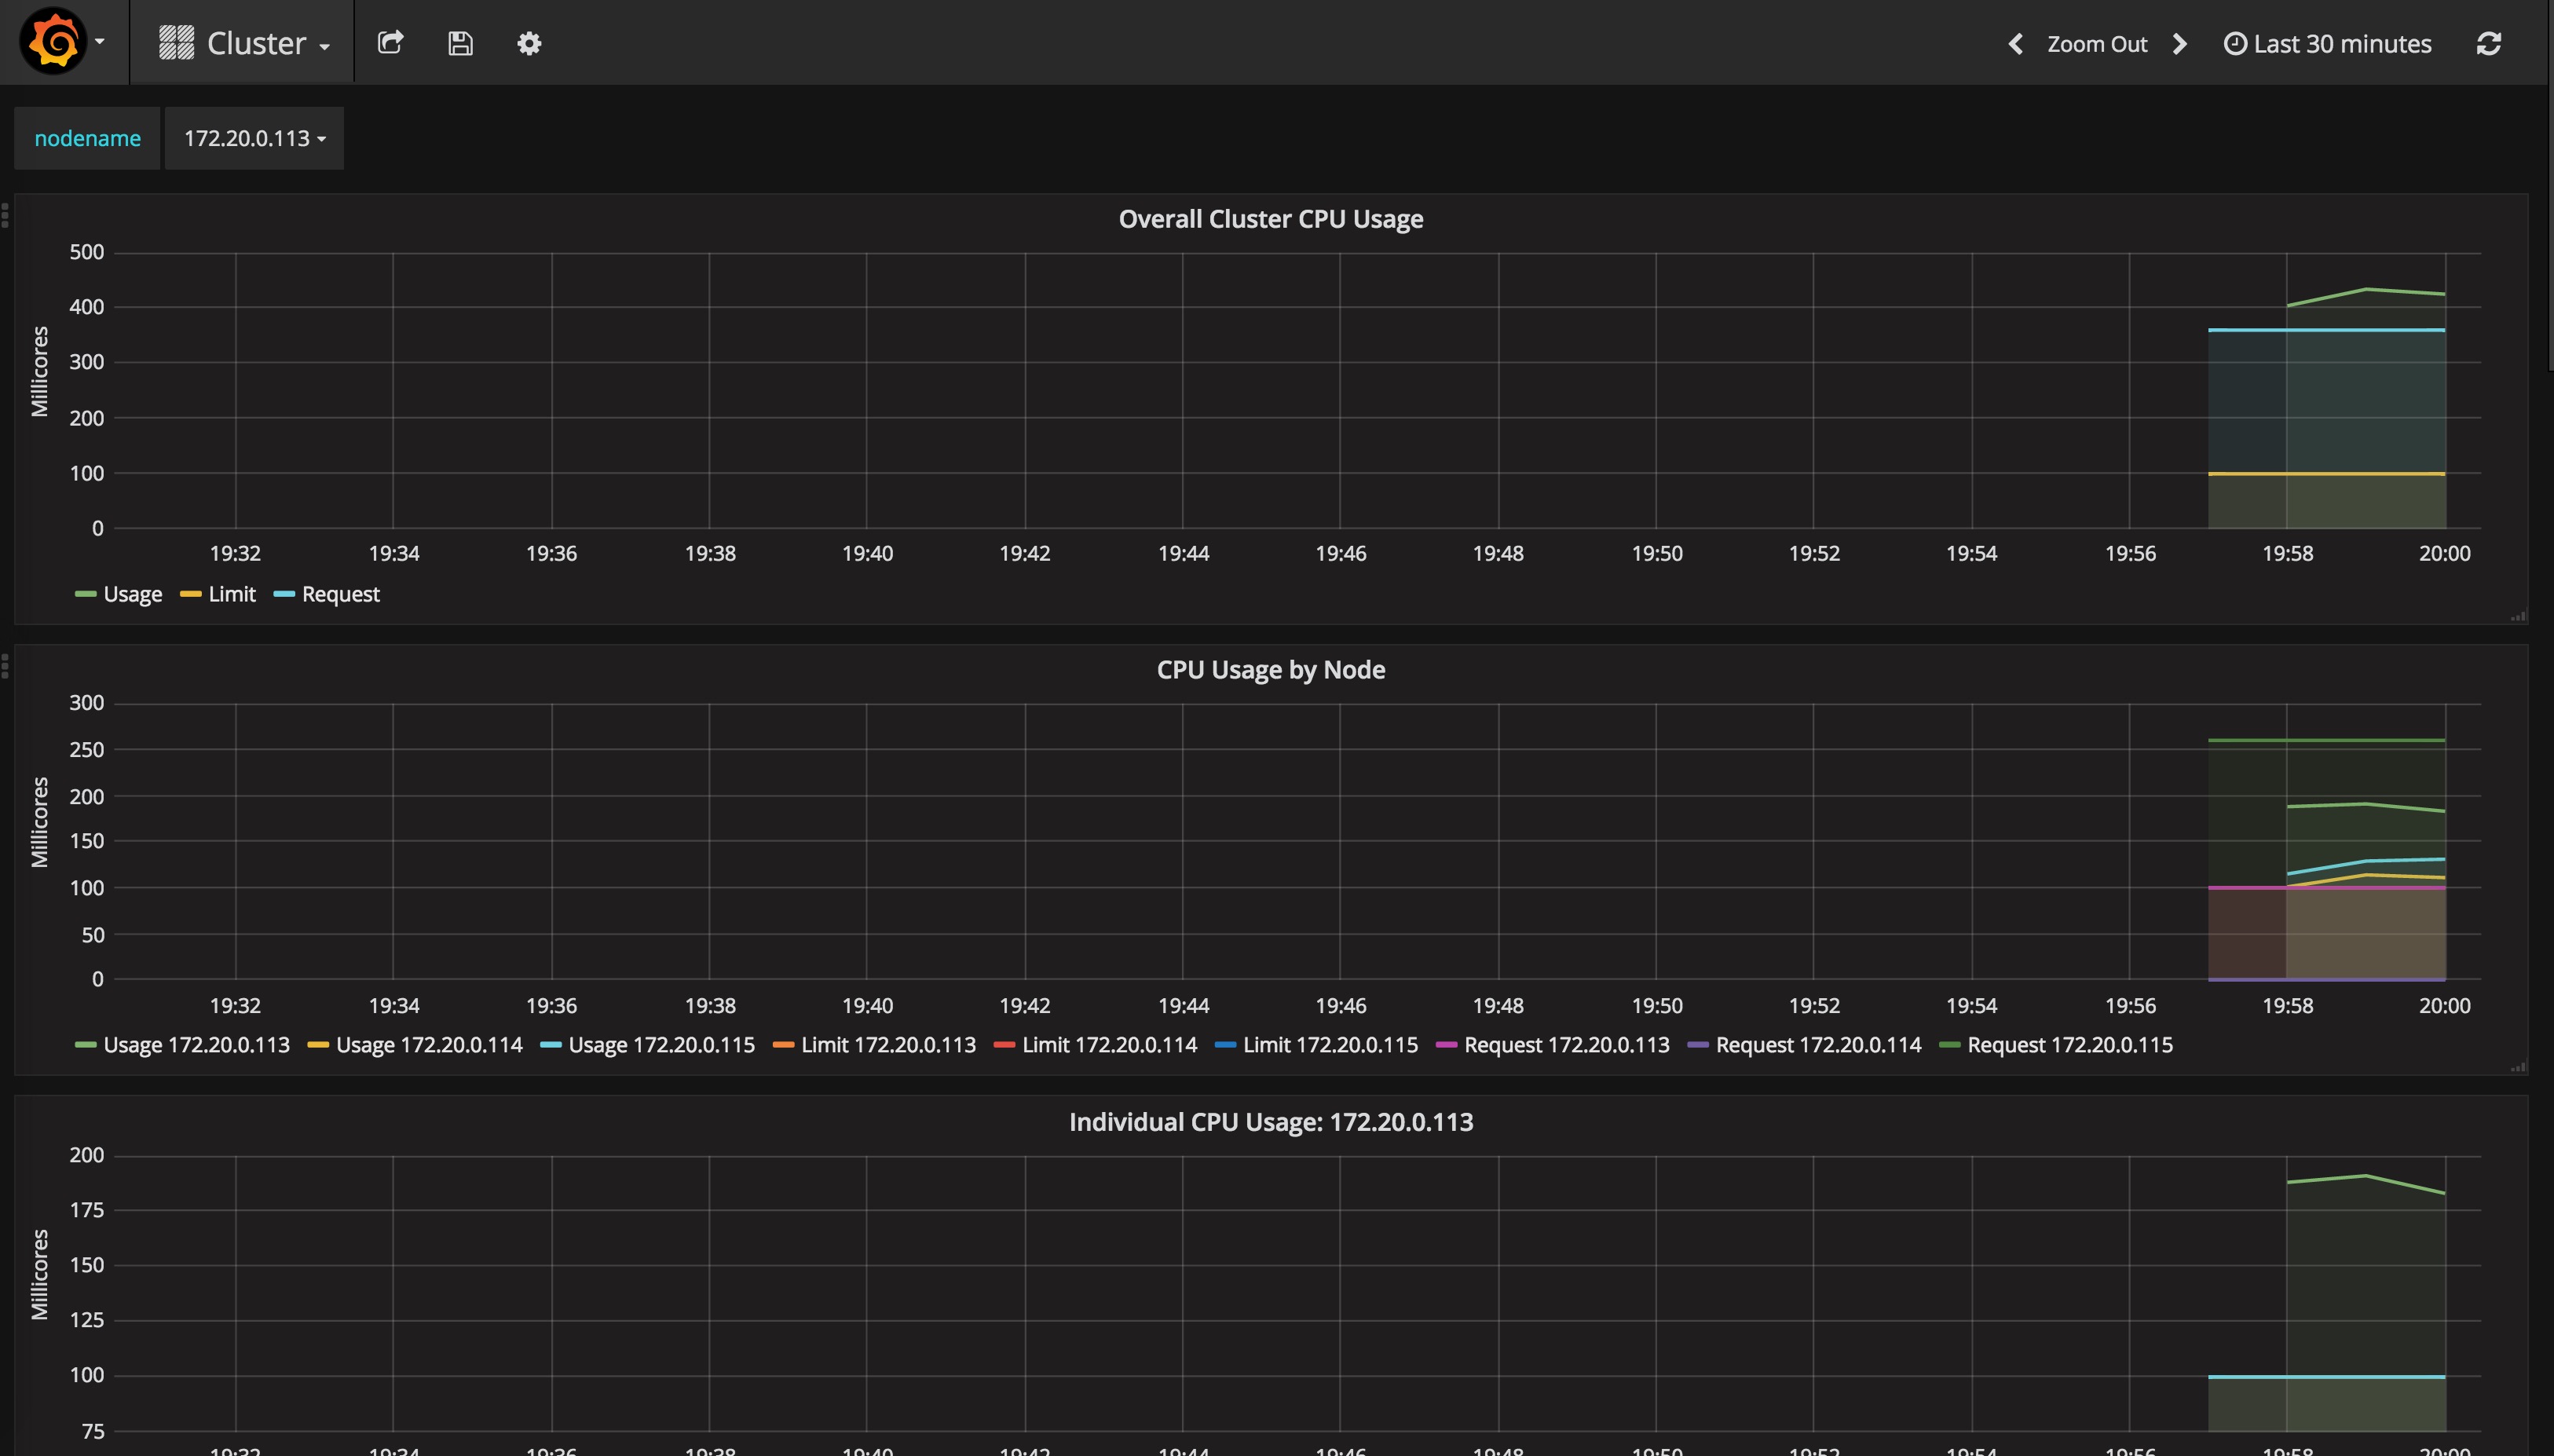
访问 grafana
通过 kube-apiserver 访问:
获取 monitoring-grafana 服务 URL
$ kubectl cluster-infoKubernetes master is running at https://172.20.0.113:6443Heapster is running at https://172.20.0.113:6443/api/v1/proxy/namespaces/kube-system/services/heapsterKubeDNS is running at https://172.20.0.113:6443/api/v1/proxy/namespaces/kube-system/services/kube-dnskubernetes-dashboard is running at https://172.20.0.113:6443/api/v1/proxy/namespaces/kube-system/services/kubernetes-dashboardmonitoring-grafana is running at https://172.20.0.113:6443/api/v1/proxy/namespaces/kube-system/services/monitoring-grafanamonitoring-influxdb is running at https://172.20.0.113:6443/api/v1/proxy/namespaces/kube-system/services/monitoring-influxdbTo further debug and diagnose cluster problems, use 'kubectl cluster-info dump'.
浏览器访问 URL:
http://172.20.0.113:8080/api/v1/proxy/namespaces/kube-system/services/monitoring-grafana通过 kubectl proxy 访问:
创建代理
$ kubectl proxy --address='172.20.0.113' --port=8086 --accept-hosts='^*$'Starting to serve on 172.20.0.113:8086
浏览器访问 URL:
http://172.20.0.113:8086/api/v1/proxy/namespaces/kube-system/services/monitoring-grafana
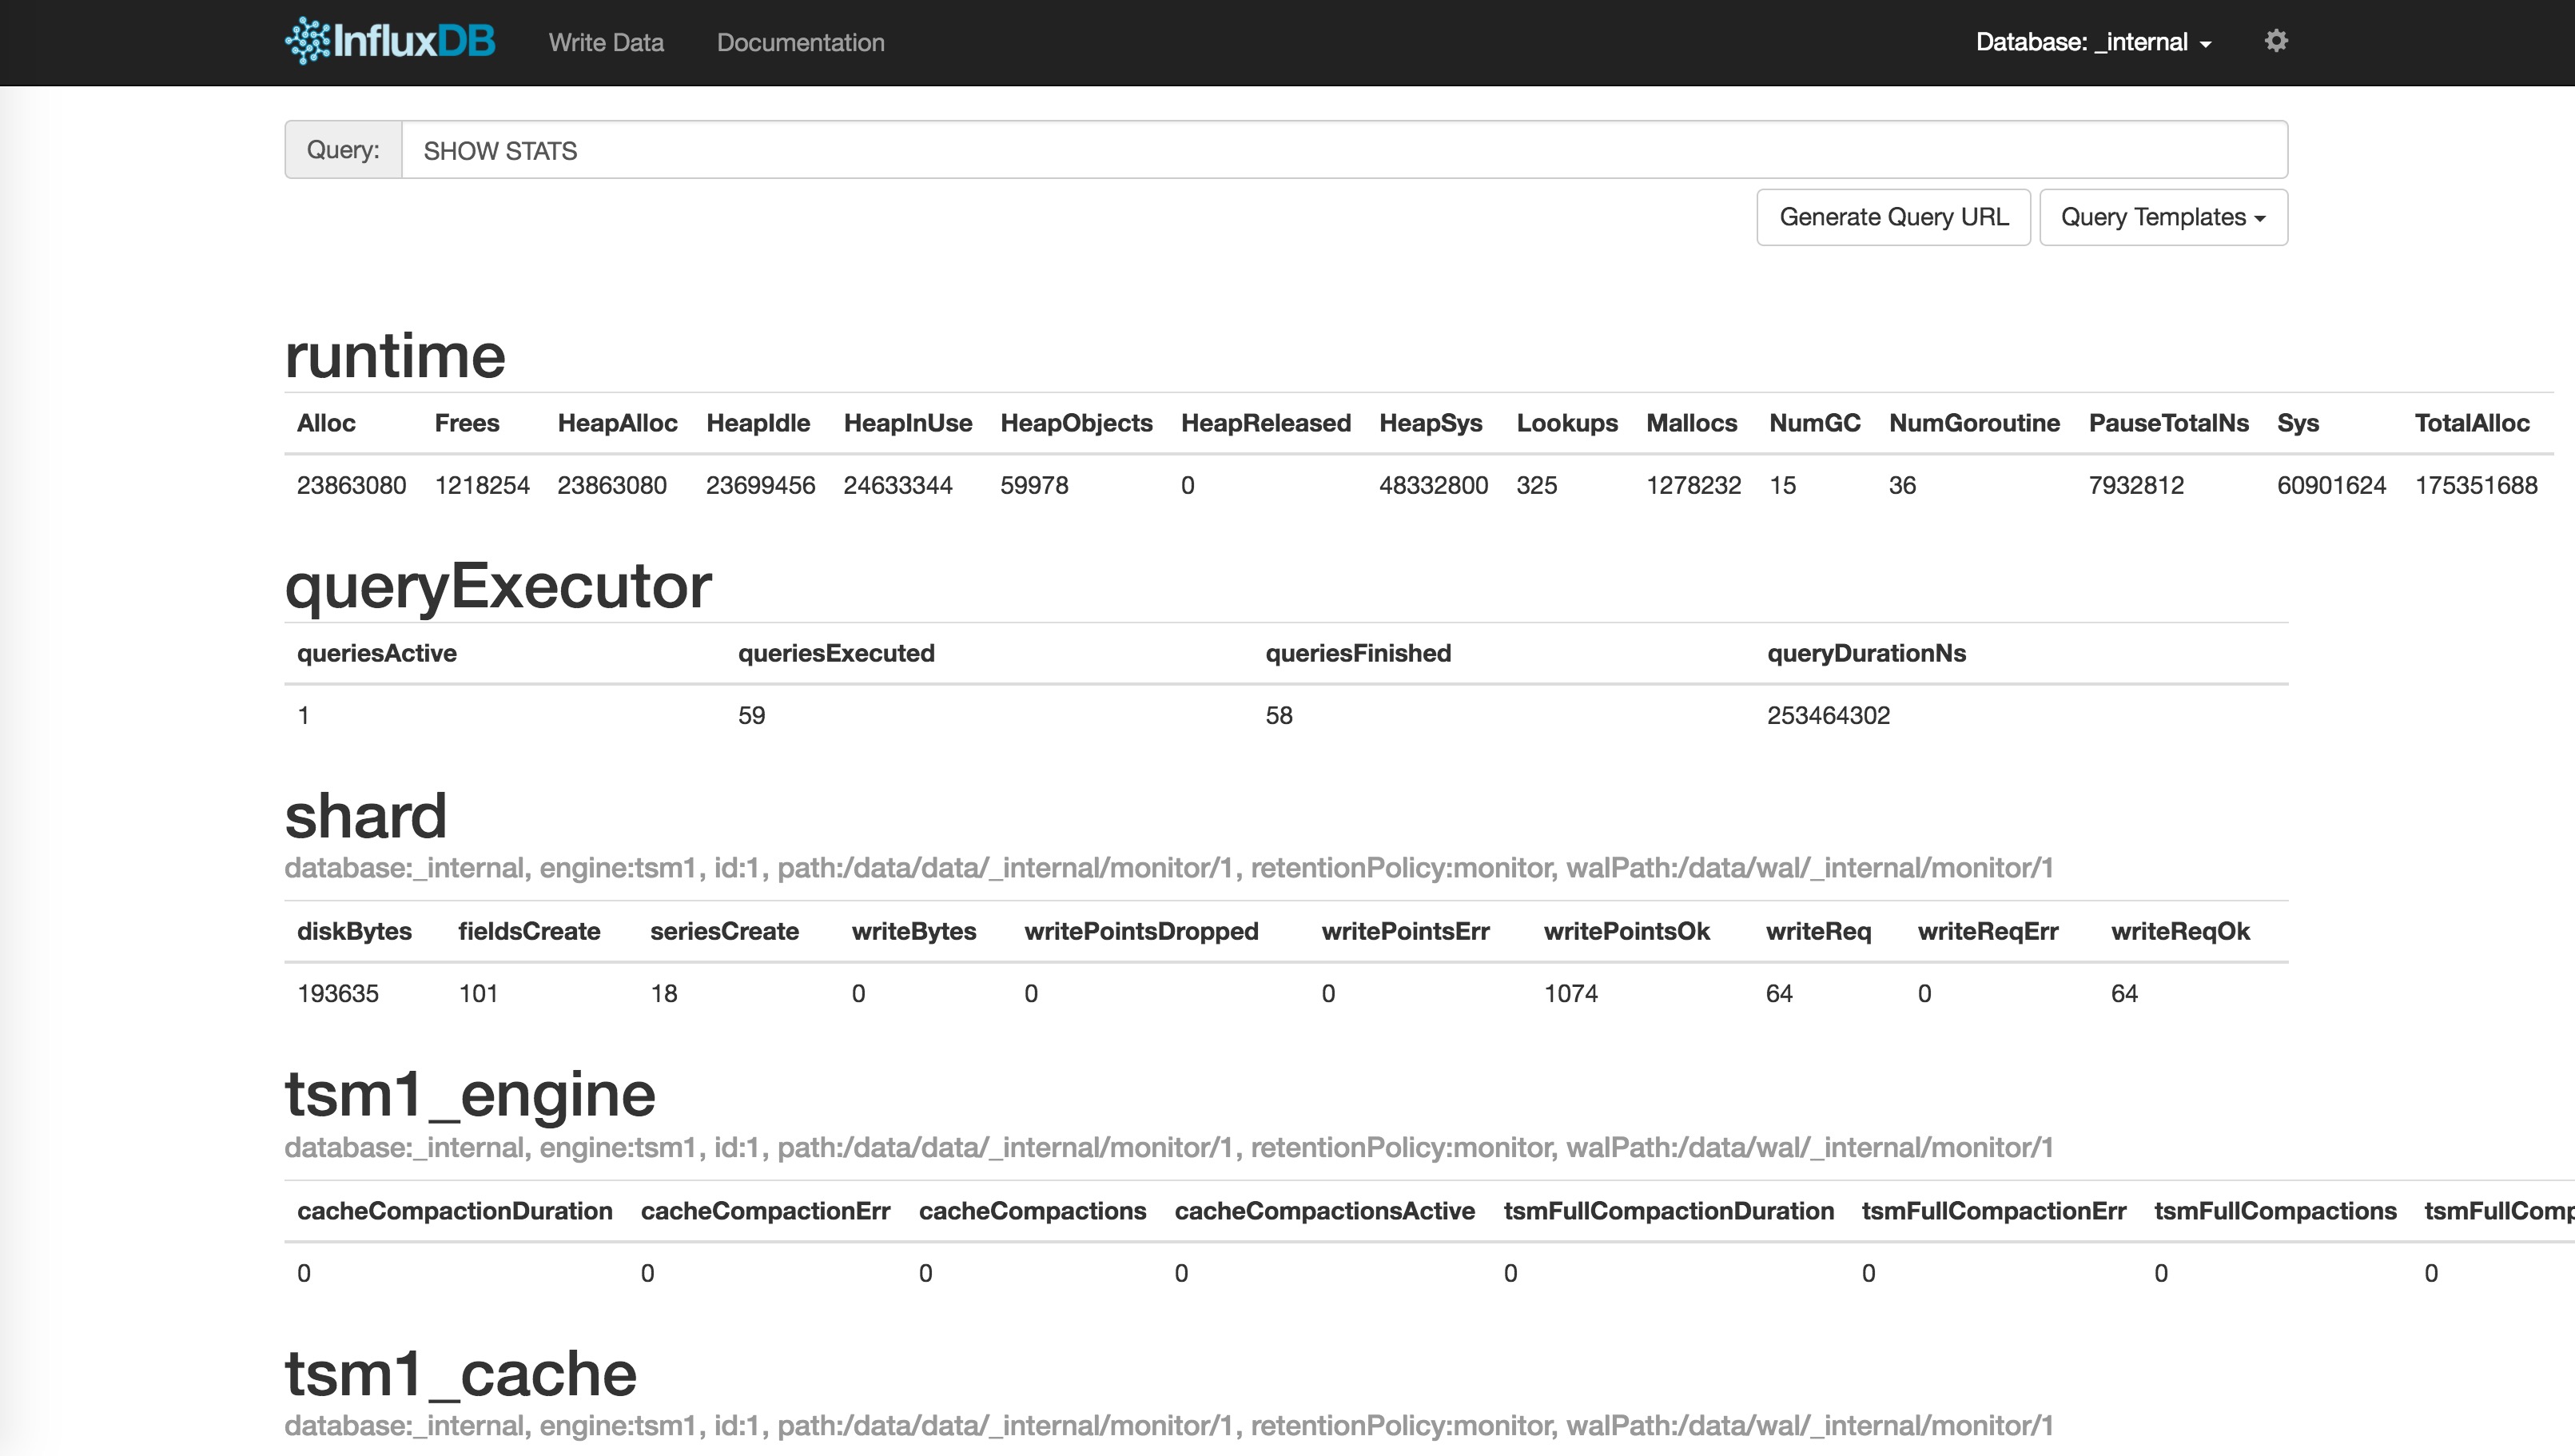
访问 influxdb admin UI
获取 influxdb http 8086 映射的 NodePort
$ kubectl get svc -n kube-system|grep influxdbmonitoring-influxdb 10.254.22.46 <nodes> 8086:32299/TCP,8083:30269/TCP 9m
通过 kube-apiserver 的非安全端口访问 influxdb 的 admin UI 界面: http://172.20.0.113:8080/api/v1/proxy/namespaces/kube-system/services/monitoring-influxdb:8083/
在页面的 “Connection Settings” 的 Host 中输入 node IP, Port 中输入 8086 映射的 nodePort 如上面的 32299,点击 “Save” 即可(我的集群中的地址是172.20.0.113:32299):
注意
在安装好 Grafana 之后我们使用的是默认的 template 配置,页面上的 namespace 选择里只有 default 和 kube-system,并不是说其他的 namespace 里的指标没有得到监控,只是我们没有在 Grafana 中开启他它们的显示而已。见 Cannot see other namespaces except, kube-system and default #1279。
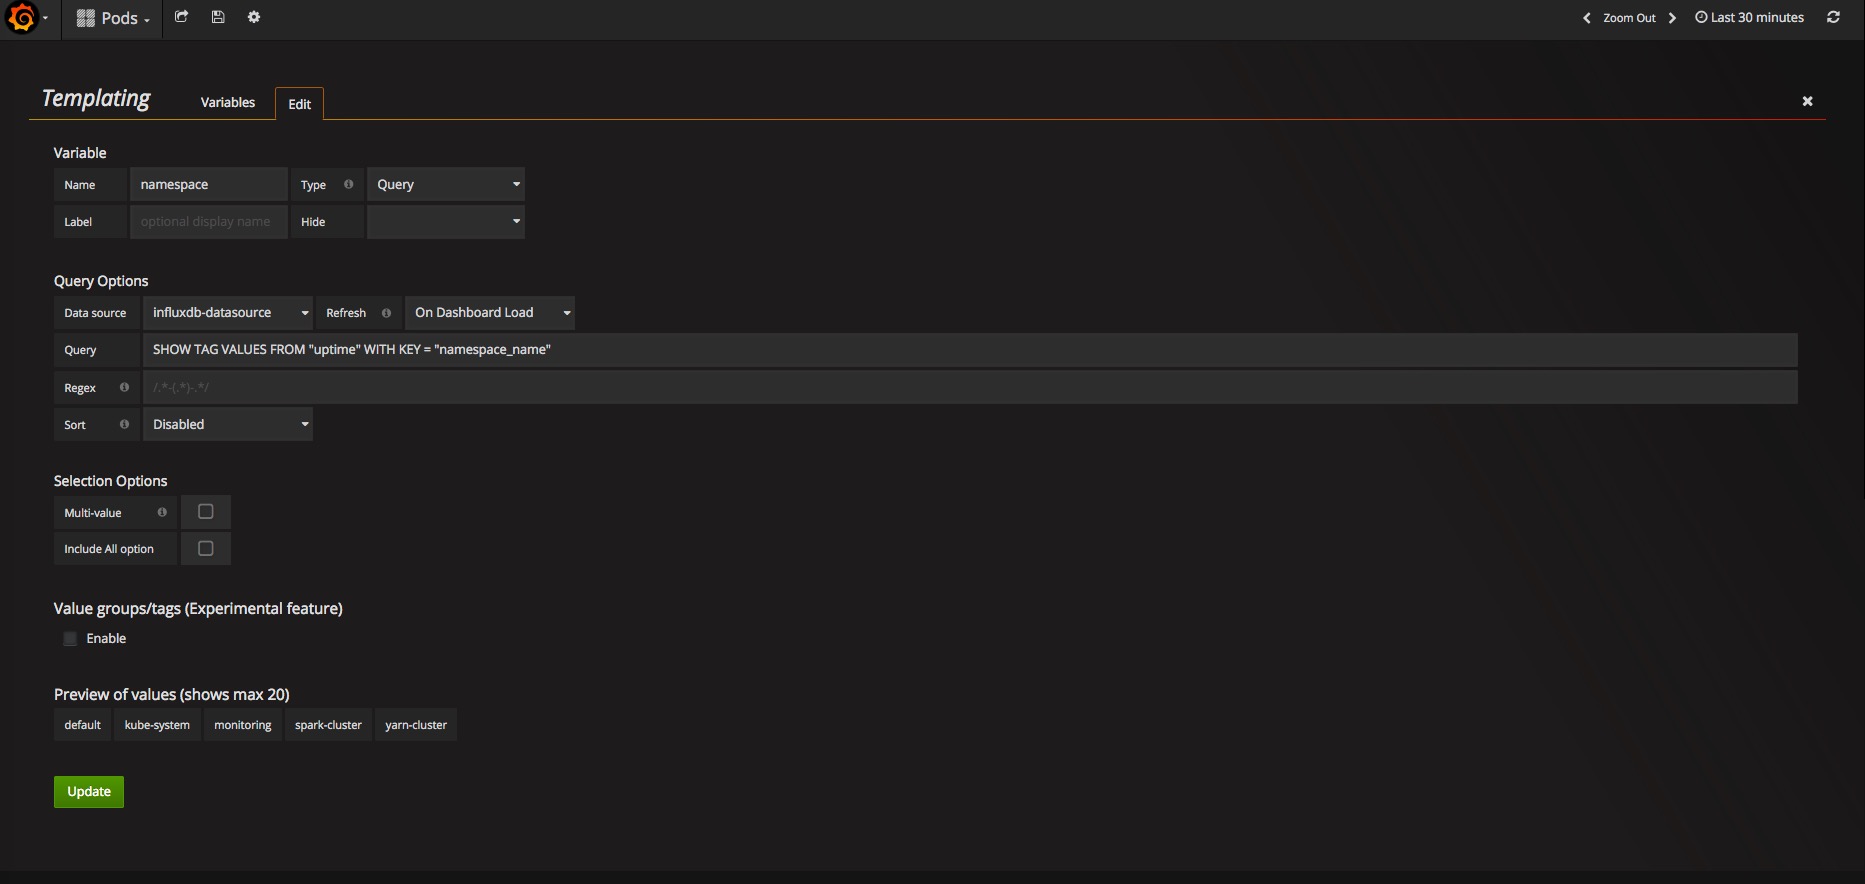
将 Templating 中的 namespace 的 Data source 设置为 influxdb-datasource,Refresh 设置为 on Dashboard Load 保存设置,刷新浏览器,即可看到其他 namespace 选项。
参考
使用Heapster获取集群对象的metric数据
